
According to a recent study, New York’s coastline, along with the communities that surround its tributaries, could be submerged in water in the near future due to rising sea levels. The study utilized a new predictive tool that forecasts the impact of sea level rise on coastal areas, similar to other regions along the east coast.
NOAA has developed a tool called The Sea Level Rise Viewer which offers varying scenarios of oceanic rise from the best to worst predicted cases in the coming decades. The tool even forecasts as far as the year 2100.
By the year 2100, the sea level in Montauk, New York, is projected to rise by 2.49 feet in the best-case scenario and by 6.66 feet in the worst-case scenario.
Areas such as New Rochelle, Manhattan, and Willets Point are experiencing similar outcomes. The southern coastline of Long Island seems to be especially vulnerable.
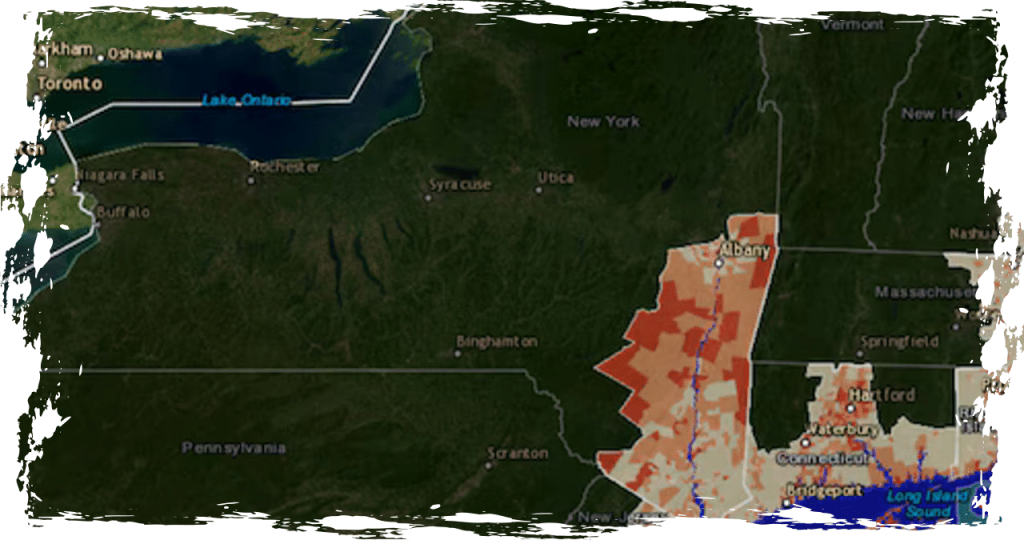
If sea levels were to rise by six feet, New York communities as far north as Albany could be at risk of flooding. This is due to the fact that certain areas that currently border creeks and rivers would become submerged, which is a major cause for concern in worst-case scenarios. These communities have been identified as vulnerable, highlighting the potential dangers that could arise from rising sea levels.
Experts warn that rising sea levels caused by climate change will have a significant impact on communities in the 21st century.
According to William Sweet, an oceanographer at NOAA, the rise in carbon emissions is causing both atmospheric and oceanic heating, leading to the melting of land-based ice sheets and glaciers. As a result, the ocean is expanding thermally, which is causing sea levels to rise along the majority of the U.S. coastlines. This was reported by NJ Advance Media, an Advance/SILive.com sister site on Wednesday.
How New Yorkers can use the new flooding prediction tool
To get started, simply enter your town or address into the search bar. This will zoom the map in on your location, giving you access to personalized sea level rise reports and real-world examples of local infrastructure, such as popular streets and recognizable signs.
You can explore the different tabs that are available on the website. The six tabs that you can browse through are Sea Level Rise, Local Scenarios, Mapping Confidence, Marsh Migration, Vulnerability, and High Tide Flooding.
You have the ability to manipulate a slider in all tabs except for High Tide Flooding, which displays the water level at various intervals, with the maximum being a 10-foot rise.
Local Scenarios provides a glimpse into the potential rise of water levels in the coming decades, culminating in the year 2100. The scenarios, which include Intermediate Low, Intermediate, Intermediate High, and High, offer varying outcomes based on the projected severity levels.
The Marsh Migration tab functions in a similar manner.
According to NJ Advance Media, the updated data is incorporated into the interactive map by NOAA in real-time.